This is part 5 in a series on End User Experience Monitoring - Use it or ‘Lose' it.
In part 4 of this series, we discussed several different views of End User Monitoring (EUM) and saw some of the advantages of analysing these views by drilling down to the root causes of poor end user experience. In this final part of the series, we will dive into the inner workings of an EUM cloud service that’s available to scale to billions of users.
What’s in the Cloud for you?
If your mission critical application gets heavily used by the end users that are spread across different parts of the world, you will require a highly available, horizontally scalable and on-demand system. Such a system must be able to collect and aggregate the EUM metrics received from the end user browsers and/or devices and have them available to you 24/7. Naturally, such a service must be a highly scalable platform that will be responsible for processing end user requests and for performing complex data analysis. The EUM cloud service provides such a mechanism for controllers to download aggregated metrics and snapshots based on customer and application identification.
One of the key architectural challenges in supporting dynamic scalability based on demand is that we have to pay for hardware upfront and over provision to handle huge spikes. These issues have been conveniently resolved today by adopting the public cloud offerings such as Amazon Web Services that scales costs linearly with demand.
Since the usage pattern for different applications throughout the day is different; the number of records to be processed at EUM Cloud may vary with different applications at different time zones. The EUM Cloud Service automatically scale up to handle any surge in the incoming records and accordingly scale down with lower load.
What’s the secret sauce behind EUM?
Different APM vendors have different implementations of End User Experience monitoring, but a majority of them tend to enable EUM in their controller, where your application’s requests are automatically instrumented with a very small piece of javascript that allows to capture critical performance metrics. The javascript agent leverages Web Episodes javascript timing library and the W3C Navigation Timing Specification to capture the end user experience metrics. Once the metrics are collected, they get pushed to the End User Monitoring cloud via a beacon for processing. A single page load will send one or more beacon–one per base page and every iframe onload and one per ajax request. All the javascript errors occurring post page load are also sent as error beacons. The functionality of the nodes is to receive the metric data from the browser and process it for the controller.
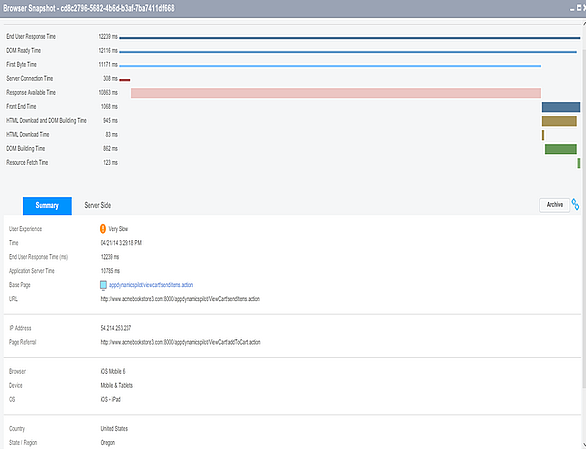
Figure 1: End User Response Time detail breakdown
The above figure gives a detail breakdown of End User Response Time that displays metric such as First Byte Time, Front End time along with many others. This gives us a clear idea about the overall user experience and how much time a particular user spent waiting for a page.
End user experience monitoring helps your organization to achieve the following goals:
Gain complete visibility of the browser rendering time, network latency, the geographical location of your end users and devices they are using for accessing your applications.
Obtain a solid measure of the performance of Web 2.0 or Rich Internet Applications (RIA) using AJAX technologies.
Proactive analytics and real time alerts for Operations team to rapidly troubleshoot the root cause of end user problem.
Provide a high level perspective to the executives/business users on what’s causing an impact on their revenue.
Allow developers to test the application better and fine tune for optimal performance.
Get separate views to accurately correlate an end user problem to it’s root cause.
Gain a complete picture of applications running in Private, Public or Hybrid Clouds.
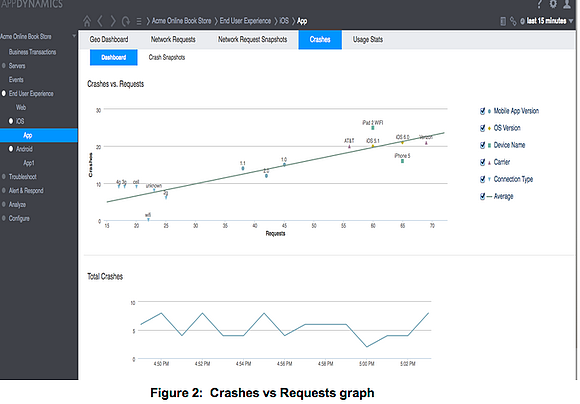
Stay tuned for our next cool blog that will walk you through the Mobile APM Dashboard offered by AppDynamics Pro. In this blog, we will explore how to monitor your native mobile applications that you have been developing and ready to push it to production or something that’s already in the App Store. We will specifically learn how to get an insight on your mobile application crash reports using the Crash Dashboard Graphs. The Crashes vs Requests graph shown below depicts how the number of crashes correlates with the number of network requests over the selected time range.
If you have any questions or want to learn more about Application Performance Management or perhaps wanted to see the End User Experience Monitoring in action, contact us and we will set you up with a free demo and a complimentary 30 day trial of the AppDynamics Pro product at no cost.